
.png)
.webp)
Observability-Driven Development (ODD): A New Era of Proactive System Reliability
Businesses now use advanced software architectures, like microservices, cloud-native, and distributed computing on digital platforms. However, monitoring solutions can be ineffective because they measure only predefined metrics. This limitation lets issues go undetected and can lead to system crashes, degraded Customer Experience, and interruptions. Identifying unknown problems becomes very difficult as a result.
One solution to this issue is through Observability-Driven Development (ODD), also known as observability-driven development, which provides complete visibility of your entire system, proactively monitors performance, and accelerates root-cause analysis and Incident Response.
This blog covers foundational concepts around ODD. It explains the significance of performance monitoring for reliability in software engineering with shift-left testing. You will learn about key challenges in observing distributed architectures, reasons for implementing Continuous Observability and Proactive observability with cloud tools, and best practices for low-latency observability across hybrid multi-cloud systems.
.webp)
Understanding Observability-Driven Development (ODD)
Observability Driven Development (ODD) allows software engineering teams to take a proactive approach towards understanding their systems rather than reacting based on what is seen or heard from their monitoring and observability tools. Using observability integrated with application monitoring and performance monitoring gives software teams visibility into how their systems behave through metrics, logs, and traces.
This approach complements practices like test-driven development, code review, and modern Project management in development teams.
As more companies move to cloud-based solutions and distributed systems architectures such as Service Oriented Architecture, modern application performance monitoring and cloud observability tools enable software teams to identify issues earlier in the process, improve reliability, and scale cloud applications.
Defining Observability in Modern Software Systems
Observability in modern software systems helps teams understand an application's internal state by analysing its outputs. Unlike traditional monitoring, observability provides deeper insights into complex distributed systems architecture and cloud environments.
- Application Monitoring and Web Application Monitoring track application health.
- Performance Monitoring and Network Performance Monitoring measure key system metrics.
- Distributed tracing tracks requests across distributed systems, cloud computing, using distributed tracing systems and distributed traces.
- Cloud Observability Tools support multi-cloud observability and hybrid cloud observability.
.webp)
Using modern application performance monitoring software and performance monitoring tools with back-end code instrumentation, teams can detect issues faster and improve system reliability.
Monitoring vs Observability: Key Differences
Monitoring and observability are closely related but serve different roles in modern software systems. Monitoring focuses on tracking predefined metrics and alerts, while observability provides deeper insights into system behaviour.
- Monitoring tracks predefined metrics using performance monitoring tools.
- Observability analyses deeper insights using application monitoring and telemetry data.
- Monitoring sends alerts for issues like latency or server errors.
- Observability helps find root causes with application performance monitoring tools and speeds up root-cause analysis.
By combining performance monitoring, application performance monitoring, and modern cloud observability tools, organisations can achieve better visibility and improved system reliability.
Core Principles of Observability-Driven Development
Using Observability-Driven Development (ODD) as part of the system development lifecycle (SDLC), we want to create a system that has inherent visibility from the beginning. We will do this by integrating observability, application monitoring and telemetry data into our development processes so that during the time we build our system.
- Collect logs, metrics and traces to improve our observability.
- Use a proactive strategy to monitor performancethrough Proactive observability.
- Integrate cloud-based observability tools with our CI/CD pipelines.
- Obtain real-time insights on application performance through Continuous Observability.
Following these strategies, organisations can support complex distributed environments including AI-driven microservices, Embedded Development, and large-scale distributed computing systems.
The Role of Performance Monitoring in ODD
The significance of Performance Monitoring in ODD is evident in how organisations can efficiently monitor and maintain proper application performance while simultaneously identifying problems with respect to user experience before they negatively impact users and disrupt Customer Experience.
This type of application performance monitoring provides additional information, such as network performance monitoring , identifying infrastructure bottlenecks, and proactively enhancing the overall cloud application performance monitoring (APM), multi-cloud observability, and hybrid cloud observability of their applications and systems.
This is especially important for platforms handling large volumes of e-commerce transaction data.
Types of Performance Monitoring in Cloud Applications
Cloud-based applications require specialised monitoring techniques because they run on a dynamic infrastructure that scales automatically. Several types of performance monitoring help organisations understand system behaviour across various layers of the technology stack.
- Application performance monitoring (APM) for analysing application performance and user experience
- Network performance monitoring for tracking connectivity and data flow across services
- Cloud application performance monitoring for monitoring cloud infrastructure and resources
- Web application monitoring for ensuring optimal website performance
.webp)
Tools such as New Relic and Sumo Logic are widely used for monitoring distributed cloud systems.
Tools and Technologies for Performance Monitoring
Organizations selecting the right application performance monitoring tool can significantly improve system visibility and reduce downtime caused by performance issues.
Integrating Performance Monitoring into DevOps Workflows
Current Methods in DevOps will place an emphasis on Continuous Integration, Continuous Deployment, and delivering software faster. If performance and application monitoring are incorporated into the DevOps workflow, the team will be able to detect any performance issues early in the process.
- Use the application performance monitoring tools for monitoring the performance while testing.
- Utilise performance monitoring tools for analysis of metrics in staging environments.
- Utilise cloud application performance monitoring to detect performance issues before they affect users.
- Utilise cloud observability tools to facilitate continuous feedback and improve Incident Response.
By incorporating monitoring into the DevOps pipeline, an organisation can enable Observability-Driven Development (ODD), as well as increase the reliability of its applications in distributed systems and modern cloud environments.
Shift-Left Strategies in Observability-Driven Development
Shift Left Testing is transforming how software teams ensure quality and reliability. Instead of testing only at later stages, modern DevOps practices move testing and observability earlier in the development lifecycle to detect issues before production.
This approach aligns closely with test-driven development practices in modern software engineering teams.
Understanding Shift-Left Testing in Software Development
Shift Left Testing integrates testing earlier in the software development lifecycle instead of waiting for later stages. This approach allows teams to detect bugs, performance issues, and architectural problems during development.
- Run automated tests using shift-left software testing.
- Integrate testing in CI/CD pipelines with a shift-left testing strategy.
- Apply performance monitoring during development stages.
- Detect issues early with a shift-left testing approach.
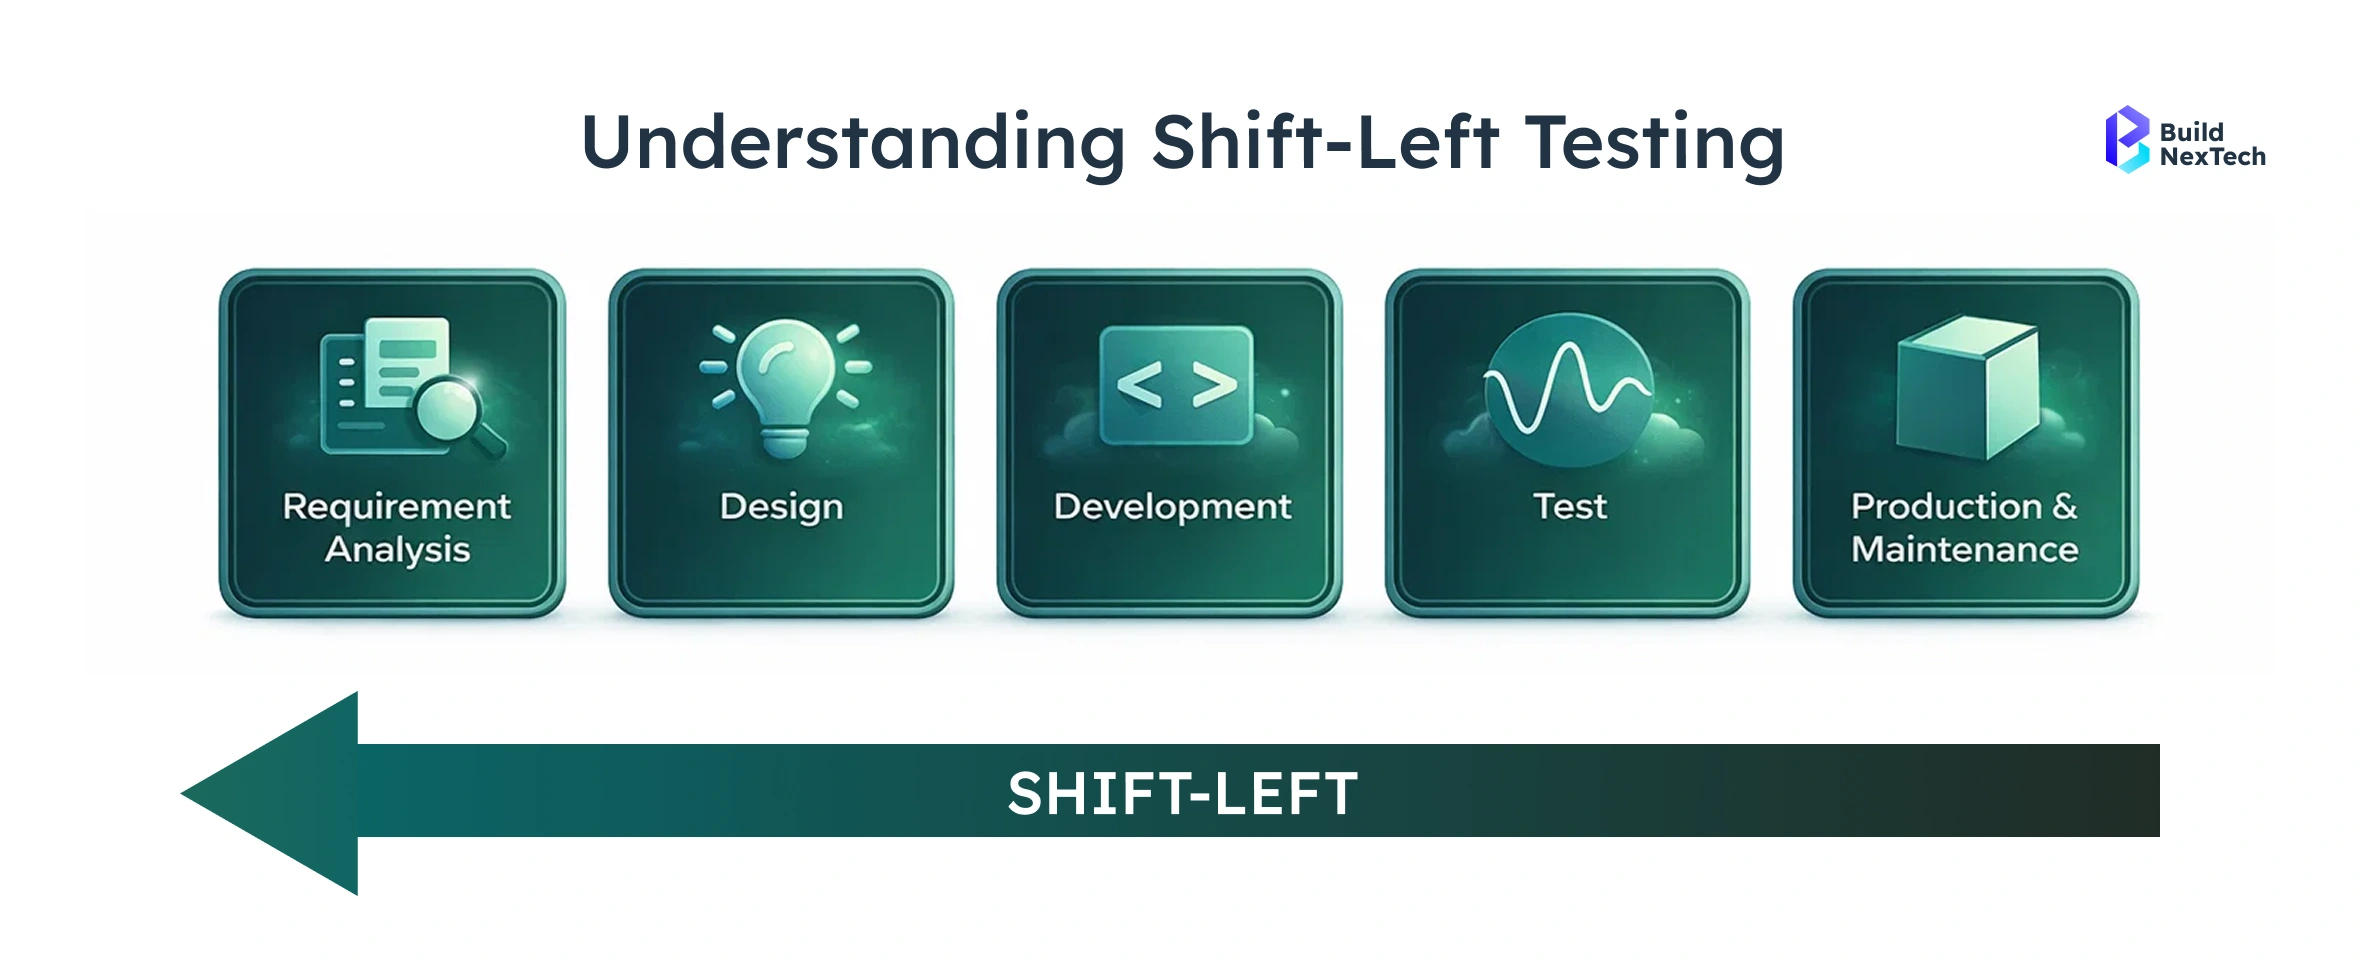
Adopting shift-left testing helps organisations improve software quality, reduce defects, and support reliable Observability-Driven Development (ODD) practices.
Shift-Left Security Testing for Cloud Applications
Shift Left Security Testing integrates security checks early in the development lifecycle to prevent vulnerabilities before deployment. In modern cloud applications and distributed systems cloud computing, early security testing helps reduce risks and protect sensitive data.
- Run vulnerability checks with shift-left security testing.
- Apply secure coding with a shift left testing strategy.
- Analyse infrastructure risks in cloud environments.
- Monitor threats using cloud observability tools.
By adopting shift-left testing and early security practices, organisations can improve application security while supporting reliable Observability-Driven Development (ODD).
Continuous Feedback Loops and Early Defect Detection
Continuous feedback loops are essential in Observability-Driven Development (ODD) because they help teams detect issues early and improve system performance. By using observability and real-time telemetry data, engineers can quickly analyse system behaviour in distributed systems environments.
- Monitor metrics using performance monitoring and application monitoring.
- Detect anomalies with cloud observability tools and automated alerts.
- Track trends using application performance monitoring dashboards.
- Optimise systems with continuous feedback from performance monitoring tools.
These practices strengthen digital resilience in modern distributed environments.
Distributed Systems and Observability
Distributed system architectures are commonly utilised by many modern applications that consist of numerous services capable of communicating over a cloud network. While distributed systems provide increased scalability and flexibility through the use of cloud computing, distributed systems pose many challenges regarding how to monitor, debug, and maintain performance.
- Services run across the distributed systems infrastructure.
- Failures may occur across multiple system components.
- Network performance monitoring helps track latency issues.
- Cloud observability tools provide end-to-end visibility.
These systems often rely on Service Oriented Architecture, AI-driven microservices, and large-scale distributed computing environments.
Distributed Systems Architecture and Observability Challenges
Distributed systems architecture introduces new observability challenges because system behaviour is spread across multiple services and cloud infrastructure. In modern distributed systems, cloud computing teams must analyse telemetry data across services to understand system interactions.
- Microservices communicate through APIs and messaging systems.
- Infrastructure scales across cloud platforms dynamically.
- Failures occur across network or service layers.
- Distributed tracing helps analyse distributed control systems.
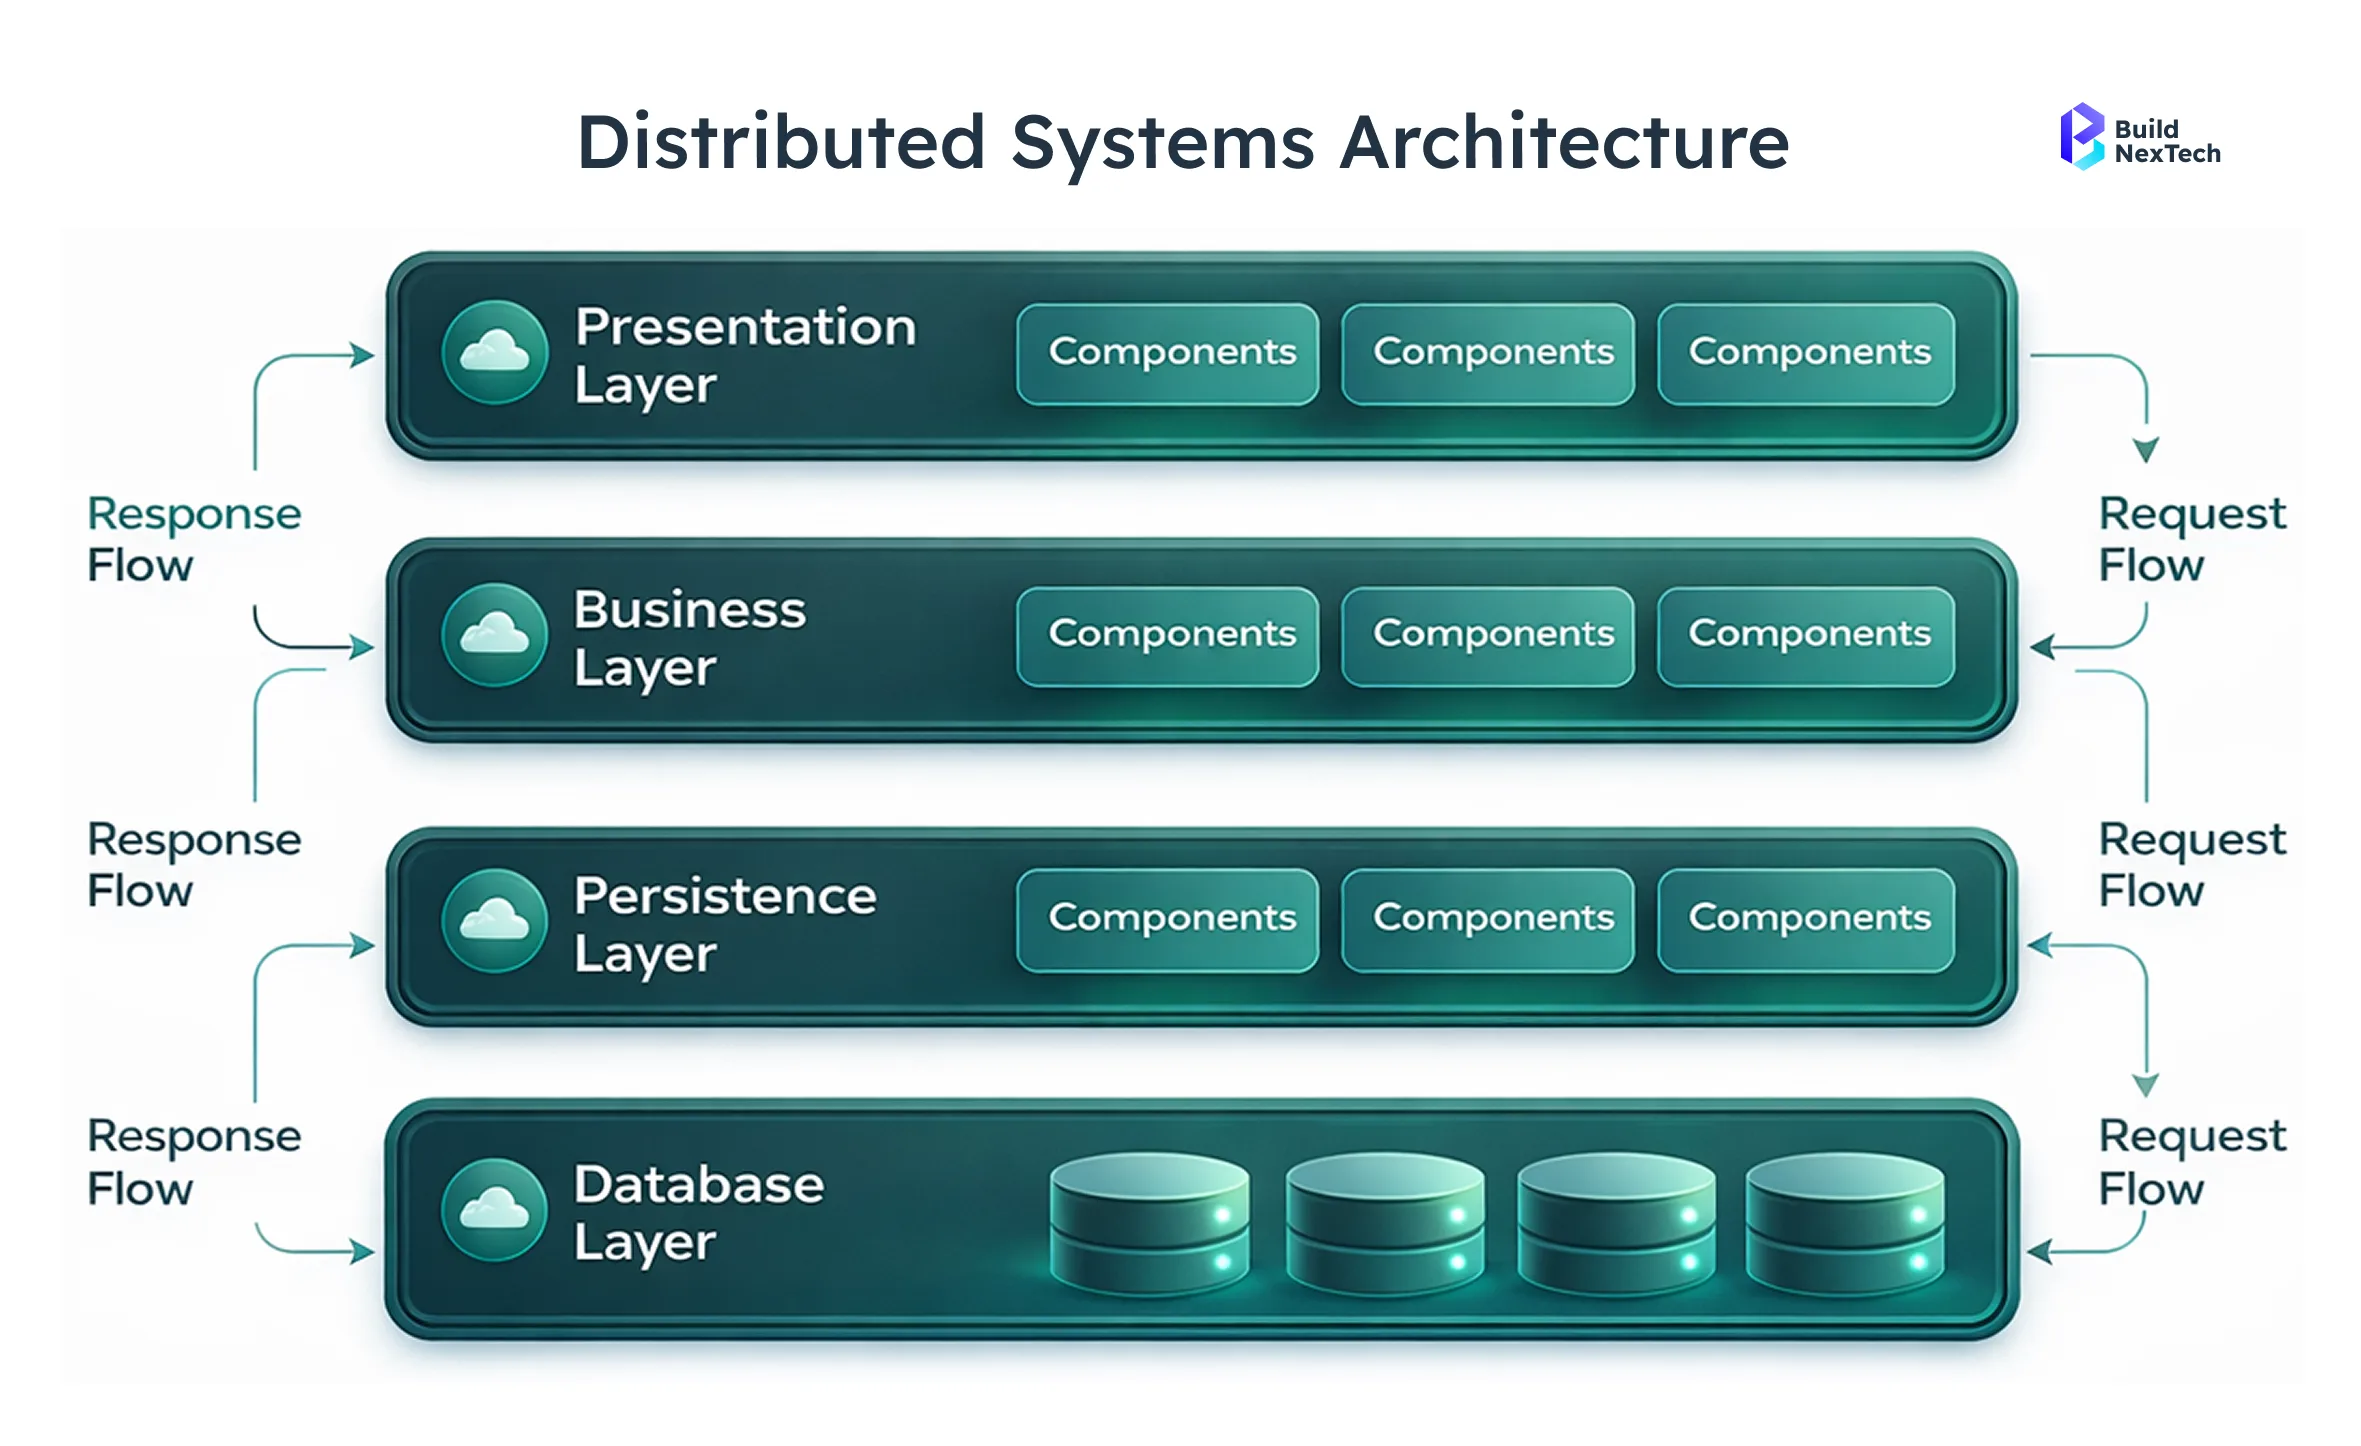
Using strong observability frameworks and cloud observability tools, organisations can maintain stability and monitor complex distributed environments.
Cloud Observability Tools and Multi-Cloud Strategies
As organisations adopt multi-cloud observability strategies, monitoring systems must support multiple cloud platforms at the same time. Modern cloud observability tools help teams manage applications across AWS, Google Cloud, and private infrastructure.
- Monitor applications across multi-cloud environments.
- Use dashboards for application monitoring and infrastructure metrics.
- Enable alerts with cloud application performance monitoring.
- Support hybrid cloud observability strategies.
With strong cloud observability practices, organisations can maintain visibility, performance, and reliability across complex cloud infrastructures.
Best Practices for Monitoring Distributed Systems
In order to ensure optimal performance of distributed systems, engineering teams need to develop effective monitoring strategies that rely on three main types of tools:
- Observability frameworks,
- Performance management solutions
- Automated analysis tools.
By using these types of monitoring strategies, organisations can achieve stable performance levels in their distributed environment and within their cloud platforms.
Best Practices for Implementing ODD
For Organizations to successfully implement Observability Driven Development (ODD), they must deploy the tools necessary to create an observability-driven development environment.
Utilising cloud-based observability tools and application performance monitoring (APM tools) solutions allows organisations to continuously analyse telemetry data and maintain strong Incident Response strategies while improving Project management visibility.
Building a Culture of Observability Across Teams
Creating a strong observability-driven development culture means making system visibility, application monitoring, and performance monitoring a core part of everyday development and operations.
- Encourage developers to instrument applications with telemetry data using back-end code instrumentation.
- Provide regular observability training to help engineering teams understand monitoring tools and metrics.
- Integrate monitoring dashboards into daily workflows to track application performance monitoring insights.
- Promote collaboration between DevOps, developers, and security teams for faster Incident Response in distributed systems.
Regular code review practices also help maintain reliability and stability across development teams.
Choosing the Right Observability and Performance Monitoring Tools
Choosing the appropriate observability software is vital to creating a successful observability program. Businesses should concentrate on tools that provide scalability, interoperability with other systems, and advanced analytics, as these features will allow them to obtain deeper insight into their systems' monitoring, performance, and operation.
- Application Performance Monitoring Tools - Track monitoring of applications' health.
- Cloud Observability Tools - Monitor distributed cloud-based systems.
- Network Performance Monitoring Tools - Analyze network connectivity.
- Enterprise Observability Applications - Centralised monitoring across all levels of your business.
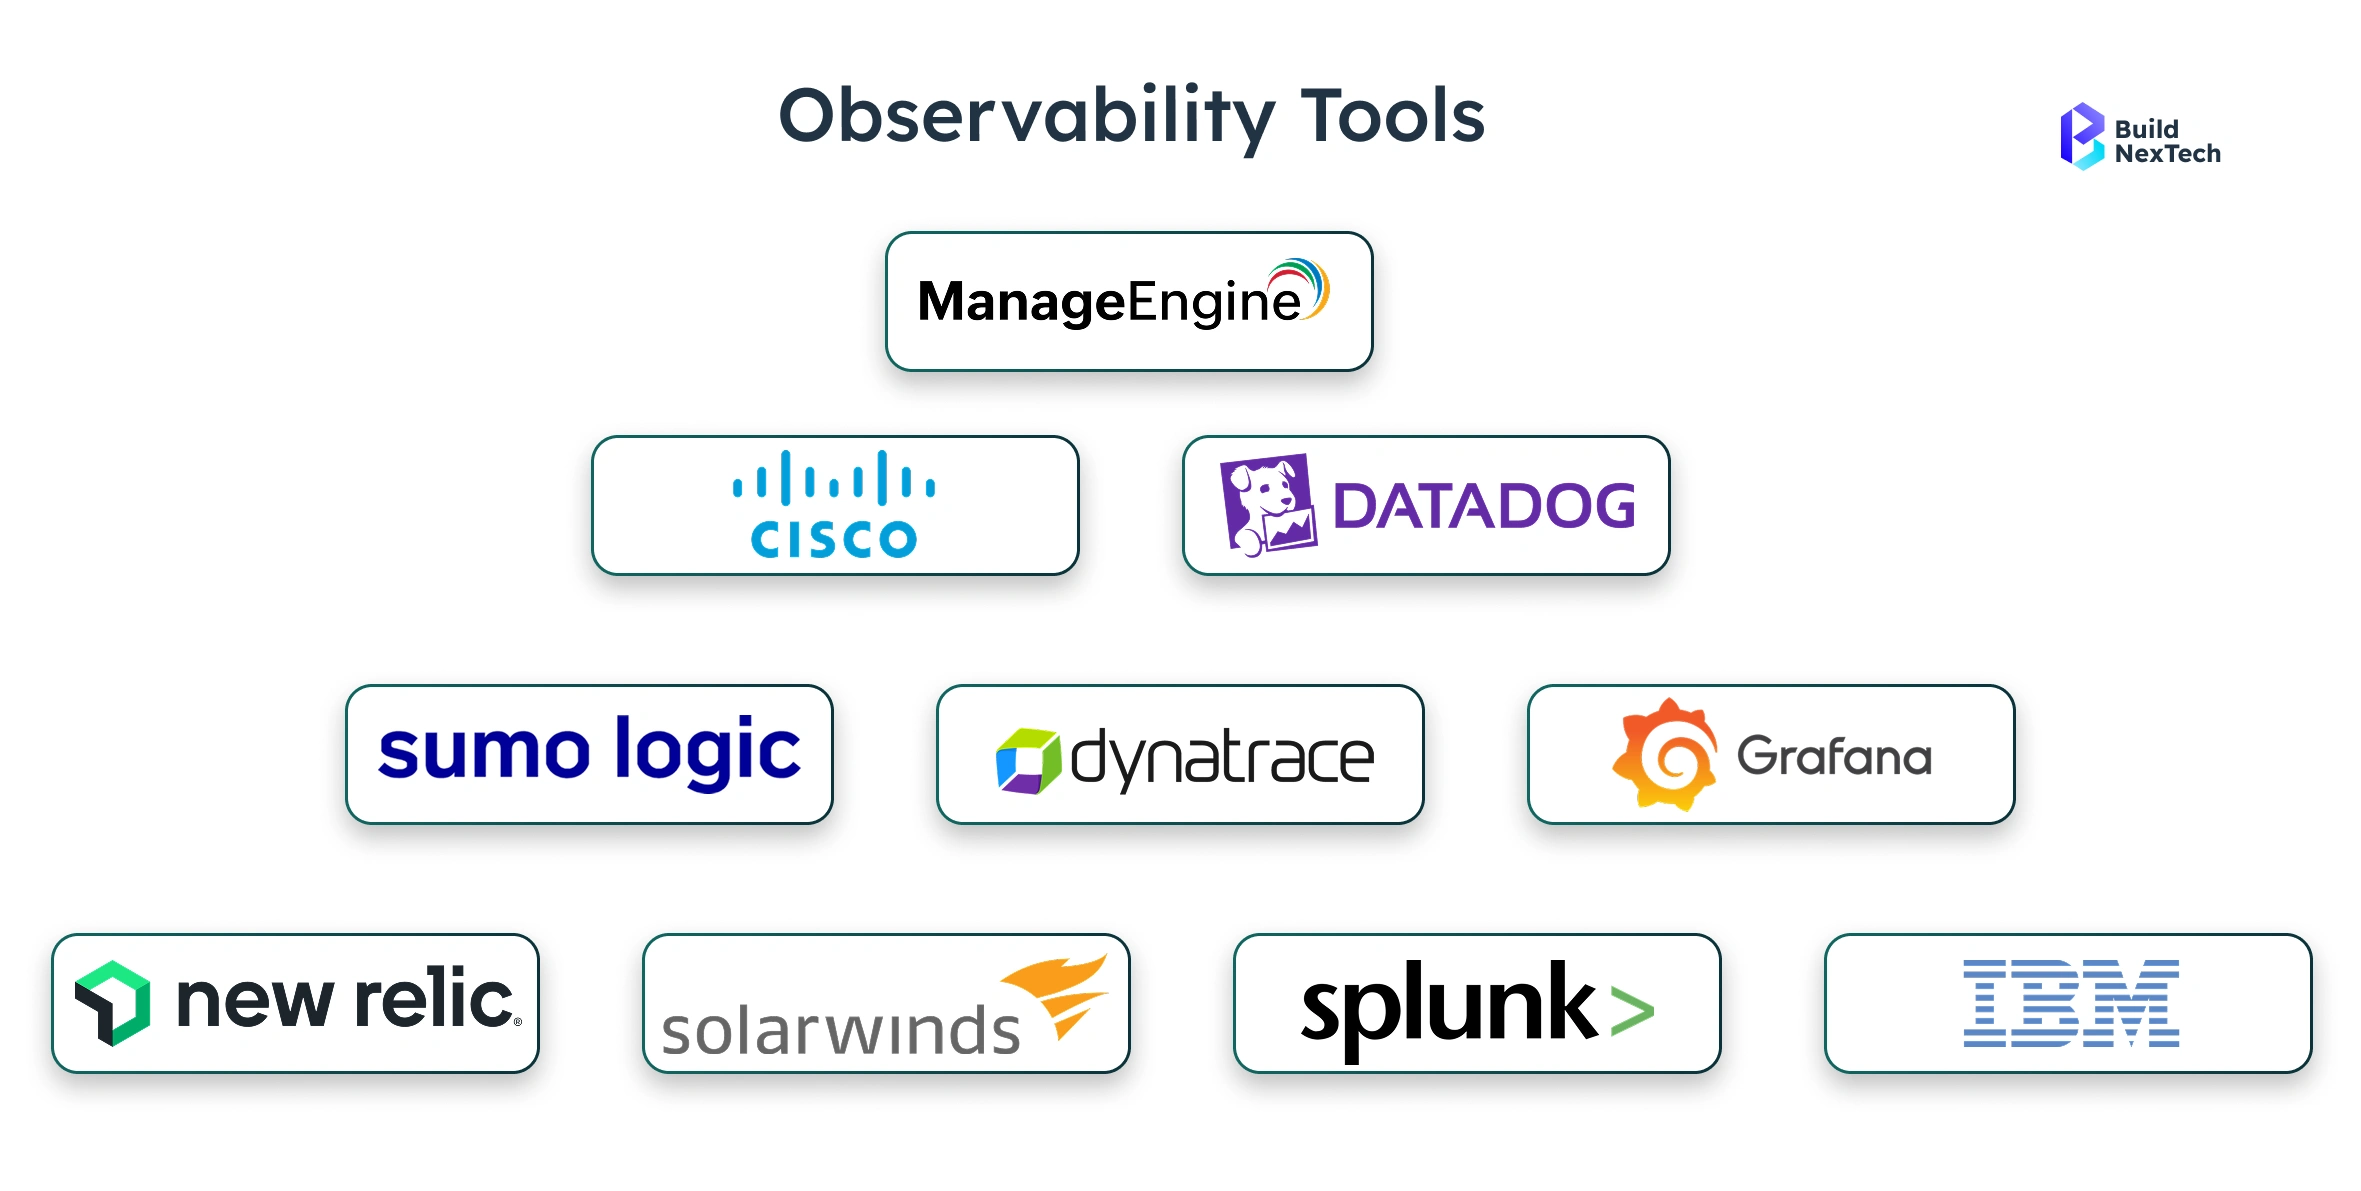
Common platforms include New Relic and Sumo Logic.
Defining Clear Metrics and Reliability Objectives
Defining clear reliability metrics helps engineering teams measure system performance and maintain service quality. Metrics such as service latency, error rates, and system availability provide valuable insights into application health.
- Define service-level objectives (SLOs) for system reliability.
- Monitor system latency and throughput metrics.
- Track application errors and infrastructure performance
- Continuously evaluate reliability metrics for improvement.
Clear performance metrics enable organisations to maintain consistent service quality and improve system reliability over time.
Conclusion: Accelerating Observability-Driven Development with bnxt.ai
The growing complexity of modern cloud-native applications makes observability an essential part of software development. By combining observability principles with continuous performance monitoring, proactive testing, and advanced cloud observability tools, organizations can detect issues earlier, improve system reliability, and deliver better user experiences.
Through capabilities such as real-time performance monitoring, advanced analytics, unified dashboards, and scalable monitoring solutions, engineering teams can gain deeper visibility into distributed systems and effectively manage hybrid and multi-cloud environments.
If you're looking to strengthen your cloud observability and performance monitoring strategy, explore Bnxt.ai to see how it helps teams build resilient, scalable, and high-performing applications for today’s digital landscape.
People Also Ask

1. What are the key benefits of Observability-Driven Development?
It helps detect issues earlier and provides deeper insights into system performance. This improves reliability and speeds up troubleshooting.
2. How does performance monitoring differ from observability?
Performance monitoring tracks specific metrics like response time and CPU usage. Observability analyzes logs, metrics, and traces to find the root cause of issues.
3. What are the best tools for application performance monitoring?
APM tools provide real-time monitoring, analytics, and distributed tracing. They help identify performance issues and optimize applications quickly.
4. Why is shift-left testing important in modern software development?
Shift-left testing identifies bugs earlier in the development cycle. This reduces costs and improves software quality.
5. How can organizations implement cloud observability effectively?
Organizations can use centralized tools to collect metrics, logs, and traces across cloud environments. This provides real-time visibility and faster issue detection.


.webp)
.webp)
.webp)